In this appendix, I describe some of the major datasets of precipitation and evapotranspiration that I considered but ultimately did not use as a part of my thesis research. (The datasets that I did use in my analysis are described in Chapter 2.) Most but not all of these datasets are derived from satellite remote sensing.
Perhaps this will be a useful resource to other students and scholars. I am not aware of any compendium of remote sensing datasets for hydrology. (The online NCAR Climate Data Guide25 is an excellent resource, but does not include descriptions of many of the evaporation datasets I describe in Section A.2.
Remote sensing is a rapidly changing field, as new satellites are launched and new algorithms are developed. This information is therefore likely to change as data providers release new datasets and cease publishing others.
Table A.1 lists many of the available remote sensing datasets of precipitation that (a) have global coverage, and (b) are free and either open access or in the public domain. This list is not exhaustive, but includes many of the important contemporary remote sensing datasets that one frequently encounters in the literature and which I investigated for possible use. The main analysis described in this thesis used three of these datasets, listed in Table 2.1. The remaining datasets were excluded because their spatial or temporal coverage was limited.
Table A.1. Global precipitation datasets.
| Data Set | Starts | Ends | Latitude coverage | Land or Ocean? | Temporal resolution | Spatial resolution | Units | Publisher | Long name (if applicable) | Notes | Website | Citation |
|---|---|---|---|---|---|---|---|---|---|---|---|---|
| CHELSA | 1979 | 2016 | –90° to +84° | land only | monthly | 0.008333° (30 arcsecond) | mm/day | Swiss Federal Research Institute for Forest, Snow, and Landscape Research; Yale University | Climatologies at high resolution for the earth's land surface areas | daily high-resolution gridded precipitation, based on downscaling and bias correcting ERA5 precip. with MODIS cloud cover. Supposed to have better representation of precipitation in complex terrain (i.e. mountains) compared to weather models. |
https://www.earthenv.org/precipitation | Karger et al. (2021) |
| CHIRPS | 1981 | near present | –50° to +50° | land only | daily, 5 day, monthly | 0.05° | mm/month | UC Santa Barbara and USGS | Climate Hazards Group InfraRed Precipitation with Station data | Intended for drought monitoring. | https://www.chc.ucsb.edu/data/chirps | Funk et al. (2014) |
| CMAP | 1979 | present | –90° to +90° | land and ocean | monthly, 5-day | 2.5° | mm/day | US NOAA | CPC Merged Analysis of Precipitation | Advantage: long time record. No longer recommended for research use unless long record is critical. | https://psl.noaa.gov/data/gridded/data.cmap.html | Xie et al. (1997) |
| CMORPH | 1998 | present | –60° to +60° | land and ocean | 30-min, hourly, daily | 0.25º | mm/day | US NOAA | CPC Morphing Technique (CMORPH) High Resolution Global Precipitation Estimates | From NOAA, algorithm combines data from a bunch of different microwave satellites. Various resolutions available, including a daily product at 0.25º. |
https://www.ncei.noaa.gov/access/metadata/landing-page/bin/iso?id=gov.noaa.ncdc:C00948 | Xie et al. (2019) |
| CPC Global Precip | 1979 | present | –89.5° to +89.5° | land only | daily | 0.5° | mm/day | US NOAA | CPC Global Unified Gauge-Based Analysis of Daily Precipitation | "Goal of the project is to create a suite of unified precipitation products with consistent quantity and improved quality by combining all information sources available at CPC and by taking advantage of the optimal interpolation (OI) objective analysis technique" Some missing dates. |
https://psl.noaa.gov/data/gridded/data.cpc.globalprecip.html | Xie et al. (2007), Chen et al. (2008) |
| CRU TS | 1901 | updated annually | –90° to +90° | land | monthly | 0.5° | mm/month | University of East Anglia and Met Office | Climatic Research Unit Time Series | Global gridded data over land based on interpolating ground-based observations. Includes other variables of interest to climate researchers, such as temperature, potential evapotranspiration, and others. | https://crudata.uea.ac.uk/cru/data/hrg/cru_ts_4.06/ | Harris et al. (2020) |
| GPCP v2.3 | 1979 | present | –90° to +90° | land and ocean | daily, monthly | 2.5° | mm/day | An international consortium: the Global Precipitation Climatology Project. Data is warehoused for downloading by NOAA. | Global Precipitation Climatology Project | From NOAA, "tGPCP) consists of monthly satellite-gauge and associated precipitation error estimates and covers the period January 1979 to the present" | https://www.ncei.noaa.gov/access/metadata/landing-page/bin/iso?id=gov.noaa.ncdc:C00979 | Adler et al. (2018) |
| GPM IMERG | 2000-Jun-01 | present | +89º to –89º | land and ocean | daily | 0.10º | mm/day | NASA, Goddard Earth Sciences Data and Information Services Center (GES DISC) | Global Precipitation Measurement. | The Integrated Multi-satellitE Retrievals for GPM (IMERG) is the unified U.S. algorithm that provides the multi-satellite precipitation product | https://disc.gsfc.nasa.gov/datasets/GPM_3IMERGDF_06/summary | Huffman et al. (2019) |
| GSMaP | 2000 | present | –60° to +60° | land and ocean | hourly, daily, monthly | 0.10º | mm/hour | JAXA, the Japan Aerospace Exploration Agency | Global Satellite Mapping of Precipitation | Standard, real-time, and near-term forecast datasets available. | https://sharaku.eorc.jaxa.jp/GSMaP/index.htm | Kubota et al. (2020) |
| MSWEP | 1979 | present | –90° to +90° | land and ocean | 3 hour, daily, monthly | 0.10° | mm/month | Authors Beck et al., Princeton University | Multi-Source Weighted-Ensemble Precipitation | "MSWEP incorporates daily gauge observations and accounts for gauge reporting times to reduce temporal mismatches between satellite-reanalysis estimates and gauge observations." | http://www.gloh2o.org/mswep/ | Beck et al. (2019) |
| NRL (discontinued) | 2004 | 2013 | –60° to +60° | land and ocean | 3 hourly | 0.10° | mm/ 3 hours | US Naval Research Laboratory | Naval Research Laboratory Blend High Resolution Precipitation Product | RETIRED Blended information from several satellites. Ceased production around 2013-14 (Joseph Turk, personal communication, 2022). |
https://link.springer.com/chapter/10.1007/978-90-481-2915-7_66 | Turk et al. (2010) |
| PERSIANN | 1983 | near present | –60° to +60° | land and ocean | daily | 0.25º | mm/day | US NOAA | Precipitation Estimation from Remotely Sensed Information using Artificial Neural Networks | A multi-satellite product from NOAA, inversion using machine learning neural network model. | https://iridl.ldeo.columbia.edu/SOURCES/.NOAA/.NCDC/.CDR/.PERSIANN-CDR/.v01r01/ | Ashouri et al. (2015) |
| SM2RAIN | 2007 | 2019 | +60° to -60° | land | daily | 0.25º | mm/day | Authors Massari et al., Research Institute for Geo-Hydrological Protection (IRPI), Perugia, Italy. | Daily global gridded rainfall estimated from soil moisture | multi-satellite, estimate of *rain*, NOT total precipitation. Focused on improving estimates over developing countries. Note that there are 3 or 4 different versions of this dataset with different inputs. |
https://zenodo.org/record/3854817#.YYk2Qroo9Pa | Massari et al. (2020) |
| TMPA (deprecated) | 1998 | 2019 | –50° to +50° | land and ocean | 3 hour, daily, monthly | 0.25º | mm/day | NASA | TRMM Multi-Satellite Precipitation Analysis | Widely used and highly cited, but ends on Dec. 31, 2019, and is now deprecated. The publishers encourage all users to use GPM-IMERG instead. | https://disc.gsfc.nasa.gov/datasets/TRMM_3B42_Daily_7/summary | Huffman et al. (2010), Huffman et al. (2016) |
| WorldClim | 1960 | 2000 | land | daily, monthly | 0.041667° | mm/month | Univ. of California at Davis | Downscaled via spatially interpolation from CRU TS. Available in 3 spatial resolutions, from 2.5 to 10 arcminutes. | https://worldclim.org/data/ | Fick and Hijmans (2017) |
CHELSA is a daily gridded precipitation dataset over global land surfaces, based on downscaling precipitation from the ERA5 reanalysis model using MODIS cloud cover (Karger et al. 2021). It is noteworthy for having a relatively high resolution compared to the other datasets described here (30 arcsecond, or 0.008333°, about 1km near the equator). It is published by the EarthEnv consortium, “a collaborative project of biodiversity scientists and remote sensing experts to develop near-global standardized, 1km resolution layers for monitoring and modeling biodiversity, ecosystems, and climate. The work is supported by NCEAS [National Center for Ecological Analysis and Synthesis, a research center at the University of California], NASA, NSF [US National Science Foundation], and Yale University.”
CHELSA provides daily gridded values for 2003 to 2016, and is nearly global, with coverage up to latitude 84° North. The authors state that CHELSA has better representation of precipitation in complex terrain (i.e., mountains) compared to data from numerical weather models. Nevertheless, I chose not to use this dataset, due to its limited time period.
The Climate Hazards Group InfraRed Precipitation with Station data is a high-resolution (0.05°) precipitation dataset from researchers at UC Santa Barbara and the US Geological Survey, intended for use in drought monitoring (Funk et al. 2015). It incorporates data from infrared satellite observations with in situ gage data. Its strength is its “low latency,” i.e., frequent updates, essential for forecasting drought impacts in developing countries. Nevertheless, this dataset has limited geographic coverage, focusing on mid-latitudes from –50° to +50°. Because of the limited coverage of northern latitudes, I chose not to include CHIRPS data in my analysis.
CMAP, for CPC Merged Analysis of Precipitation, is a global gridded precipitation dataset published by the Climate Prediction Center (CPC) at the US National Oceanic and Atmospheric Administration (NOAA). It is based on analysis of gauge data and satellite-derived precipitation estimates (P. Xie and Arkin 1997) with a long coverage, from January 1979 to near-present. The principal advantage of this dataset is its long time coverage. Nevertheless, it is no longer recommended for use in research unless a long record is needed. According to the Climate Data Guide published by the US National Center for Atmospheric Research (Schneider et al. 2013), CMAP is not as accurate as newer datasets “due to greater uniformity of input data sources and more advanced satellite-derived products” (Arkin and Xie 2022). The developers at NOAA CPC are no longer actively developing CMAP (nor GPCP, descibed below), but are focusing current research efforts on the dataset described next, CMPORPH.
CMORPH is a global precipitation data product published by the US National Oceanic and Atmospheric Administration (NOAA). The dataset’s full name is “CPC Morphing Technique High Resolution Global Precipitation Estimates,” where CPC is NOAA’s Climate Prediction Center in Boulder, Colorado. This dataset is “intended for the quantification of precipitation on a very high time / space resolution over a quasi global domain (60°S to 60°N) and for an extended period from 1998. It is suited for the examination of precipitation and its temporal / spatial variations across a wide spectrum of scales from meso-scale to inter-annual” (P. Xie et al. 2007).
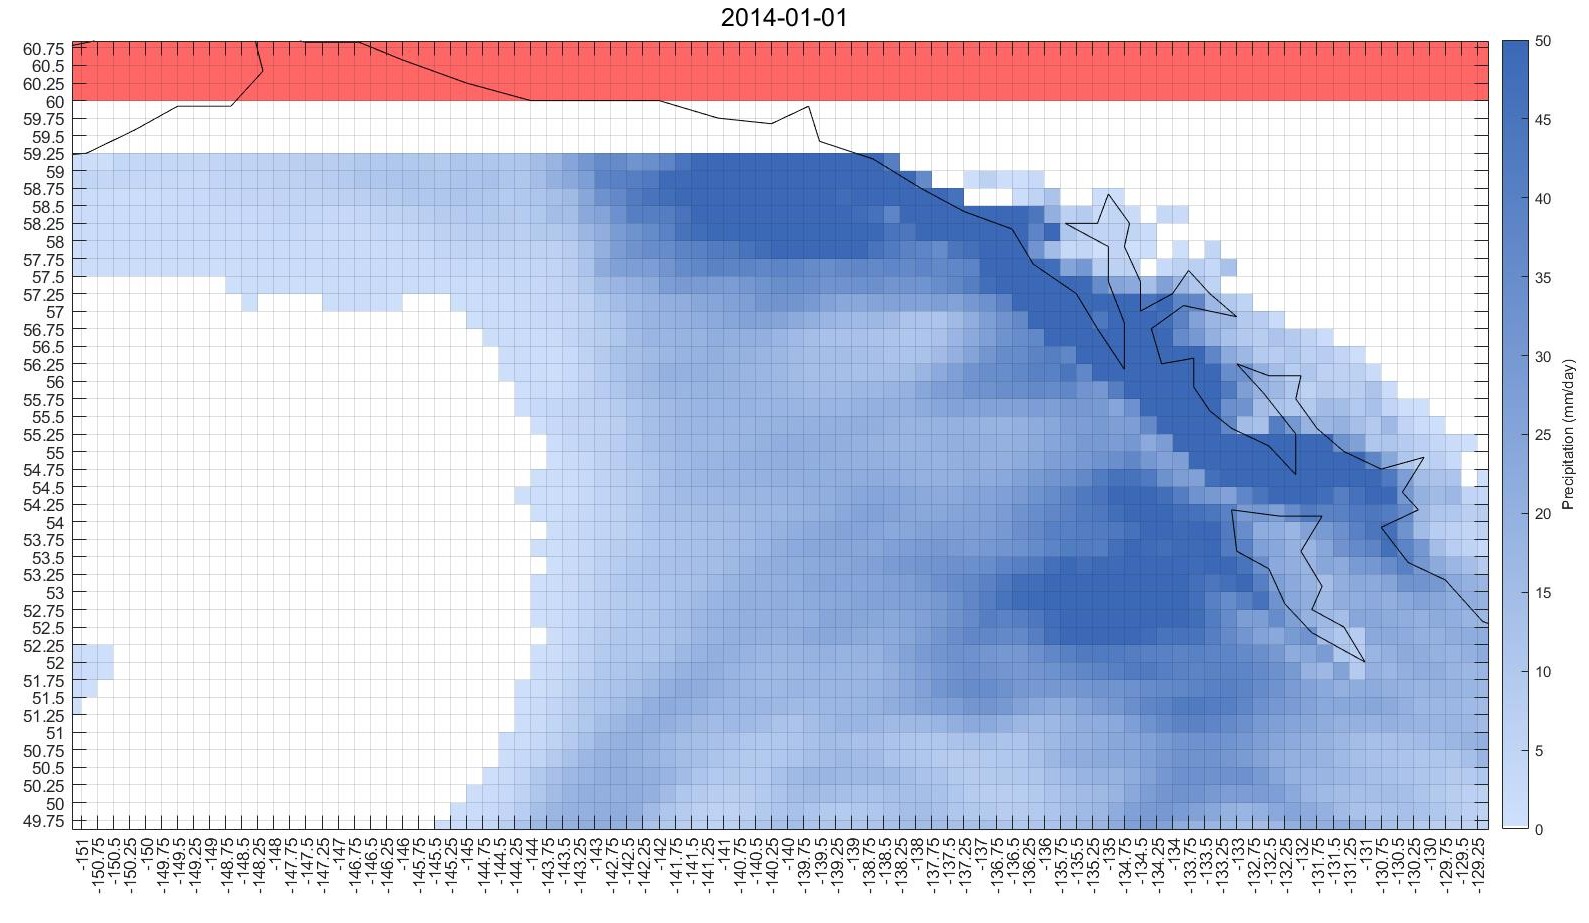
NOAA cautions that CMORPH poorly quantifies snowfall and cold season precipitation. “In particular, it tends to under-estimate the precipitation amount during cold seasons over mid- and high latitudes.” A further caution is in order based on my analysis: CMORPH contains some erroneous data. Missing data are supposed to be coded as −999, but are sometimes coded as −99.9. Another more subtle issue may be more difficult for some users to detect, and nearly went unnoticed in my analysis. While the documentation says that the data extends to latitude 60° North, I found that there is a band 3 pixels high band from 59.25° and 60° North where P = 0, as shown in Figure A.1. These zeros could be valid observations (no precipitation in that month), but they are obviously incorrect when the data is plotted and one compares values in neighboring cells. Note that in Figure A.1, to the north, the pixels shaded pink contained \(P = -999\), indicating missing data. To fix this issue, data users should replace the zeros in this band of grid cells with NaN or another missing data flag.
This data product, despite not being a remote sensing product, is also worth mentioning, as it is widely used and frequently encountered in the literature.26 The Climate Research Unit (CRU) gridded Time Series (Harris et al. 2020), is based on a curated and quality controlled set of ground-based observations. The CRU TS dataset is a collection of gridded data based on interpolating ground-based observations, jointly developed by the University of East Anglia and the UK’s Met Office.
This dataset is noteworthy because it contains a long global record of precipitation (and other variables) covering 1901 to near present, with monthly temporal resolution and a spatial resolution of 0.5°. In addition, it contains other variables of interest in climate science, such as mean atmospheric temperature (°C) at 2 meters elevation, and potential evapotranspiration (PET) in mm/day. Finally, it is worth noting that CRU TS is an exemplary model of open science, with its data and code freely available, and its research articles accessible through open access. The dataset is frequently updated and the project has long-term financial support for annual updates.
The US Naval Research Laboratory Blend High Resolution Precipitation Product is no longer in production, but I am including a brief description here as it was used in several papers closely related to my research. This was a high-resolution (0.1°) precipitation dataset combining data from several satellites in both the microwave and infrared bandwidths (Turk, Mostovoy, and Anantharaj 2010). It was available at 3-hour intervals over land and ocean. NRL ceased production of this dataset after 2013.
PERSIANN (Ashouri et al. 2014) is a global multi-satellite precipitation data product from the US National Oceanic and Atmospheric Administration (NOAA). The method, Precipitation Estimation from Remotely Sensed Information using Artificial Neural Networks, is based on work by Hsu et al. (1997) and Hsu et al. (1999). This dataset begins in January 1983, with coverage at 0.25° resolution from −60° to +60°. It is available at several temporal resolutions: hourly, 3-hourly, 6-hourly, daily, monthly, yearly. This dataset also deserves praise for its excellent website, which makes it easy to visualize and download the data. While this appears to be a high-quality dataset, I did not include it in my main analyses because of its limited geographic coverage (no data north of 60°).
SM2RAIN is a method for estimating rainfall from soil moisture data from the Italian National Research Council, Research Institute for Geo-Hydrological Protection (L. Brocca et al. 2013; Luca Brocca et al. 2014). The method infers rainfall based on datasets of soil moisture; note that it does not estimate other forms of precipitation like snow. In their 2013 paper, the authors found a reasonably good correlation between estimated and observed rainfall at 3 sites in western Europe (R = 0.90). The authors make the case that their method is useful for supplementing other data sources: “the approach can be adopted conveniently to improve rainfall estimation at a catchment scale and as a supplementary source of data to estimate rainfall at a global scale” (L. Brocca et al. 2013). In a following paper in 2014, the authors expanded their model to have global coverage, and found a reasonable fit over some but not all regions. Massari et al. (2014) used SM2RAIN data in a rainfall-runoff model and found that P inferred from soil moisture can improve flood predictions in some cases.
In 2022, when I assembled data for analysis, the SM2RAIN project had published 2 global datasets. The first dataset, CCI-SM2RAIN (Ciabatta et al. 2018), is based on ESA soil moisture products, and provides daily data over the period from January 1998 to December 2015. The ESA soil moisture data is an annually updated global climate data record of soil moisture derived from active, passive and combined microwave satellite observations (Dorigo et al. 2017). However, there are some geographic gaps in coverage: the authors have masked out “low quality data, as well as the areas characterized by high topographic complexity, high frozen soil and snow probability and presence of tropical forests.”
The second dataset in this searies, GPM-SM2RAIN, is a quasi-global daily rainfall product from the integration of GPM and SM2RAIN-based rainfall products (Massari 2020). GPM, for Global Precipiation Monitoring, is a multi-satellite precipitation product from NASA (Huffman et al. 2019), also described above. GPM-SM2RAIN is available for 2007 to 2018 between latitudes −60° and +60°, but like its predecessor, it excludes areas of complex topography, frozen soil, and tropical forests.
As of this writing in July 2023, four datasets are available. Thus, it would appear that this is an active and well-supported project. Further, the authors appear committed to open science, publishing all of their data and methods in trusted archives like Zenodo. It is well worth experimenting with these datasets in future global water balance studies. Nevertheless, I ruled out using the two SM2RAIN datasets available in 2022 due to insufficient temporal and geographic coverage. Also, the fact that these datasets include only rain (and not snow) would make it inapplicable for use in cold climates, further limiting its use.
NASA’s Tropical Rainfall Measuring Mission (TRMM) Multi-Satellite Precipitation Analysis (TMPA) is a relatively high-resolution (0.25°) precipitation dataset focused on mid latitudes from –50° to +50° (Huffman et al. 2010, 2018). While it was widely used, NASA discontinued this dataset at the end of 2019 in favor of the GPM-IMERG algorithm. One reason for its popularity is that there were two versions—a near real-time version released 6 to 9 hours after observation time, and a research product released monthly that included additional data, such as monthly surface rain gauge data. A known limitation of TMPA is that it poorly quantified moderate and light rainfall events that occur over short time intervals (Huffman et al. 2007).
WorldClim is a set of global gridded datasets over land surfaces, with coverage of monthly precipitation and minimum and maximum temperature (Fick and Hijmans 2017). It is based on downscaling the CRU TS dataset described above, with an additional step for calibration or bias correction. As such, it is not a remote sensing dataset, but rather, it is based on observations. It is worth mentioning here as it is a widely used in climate and related disciplines. The advantage of using this dataset over the source, CRU TS, is that it is available at different spatial resolutions, up to the finest resolution of 2.5 arcminutes (0.04167°, 21 km² at the equator).
Table A.2 gives an overview of the major global gridded evapotranspiration datasets that are currently available. The EO datasets I selected for the main analyses described in this thesis are summarized in Chapter 2, Table 2.1.
Table A.2. Global evapotranspiration datasets
| Data Set | Native Units | Publisher | Starts | Ends | Coverage | Temporal resolution | Spatial resolution | Notes | Website | Citation |
|---|---|---|---|---|---|---|---|---|---|---|
| Alexi | mm/day | United States Geological Survey (USGS) | 2018 | present | "Continental United States, key biomes/ agricultural zones, selected FLUXNET sites" | varies (daily often available) | 0.000278° (1 arcsecond or ~30m) | Atmosphere Land Exchange Inverse (ALEXI) Disaggregation algorithm (disALEXI), downscales ET from SEB method; originally developed for managed landscapes (i.e., irrigated cropland) | https://lpdaac.usgs.gov/products/eco3etalexiuv001/ | Hook and Fisher (2019), Fisher et al. (2020) |
| CMRSET | ? | CSIRO MODIS Reflectance-based Scaling EvapoTranspiration | ? | ? | ? | ? | ? | CSIRO MODIS Reflectance-based Scaling EvapoTranspiration. Global data no longer available. Formerly published by UNESCO IHE. Data for Australia available from CSIRO. The CMRS method can be used to calculate ET using MODIS reflectance and vegetation data. | ftp://ftp.wateraccounting.unesco-ihe.org/WaterAccounting/Data_Satellite/Evaporation/CMRSET/Global/ (dead link) | Guerschman et al. (2009) |
| CSIRO | mm/month | Australia's Commonwealth Scientific and Industrial Research Organisation (CSIRO) | 1981 | 2012 | Global | monthly | 0.5° | This dataset contains the following 4 variables: ETa - Actual evapotranspiration (mm/month) Ec - Transpiration (mm/month) Ei - Interception (mm/month) Es - Soil evaporation (mm/month) |
https://data.csiro.au/collection/csiro:17375v2 | Zhang et al. (2016) |
| ERA5 | mm/month | ECMWF, European Centre for Medium-Range Weather Forecasts | 1950 | present | Global | 3-hour, daily, monthly | 0.25º | Output from the ERA5 global climate model. NOT an RS data projduct, although uses assimilation. "Atmospheric reanalysis combines a weather model with observational data from satellites and ground sensors to build a complete and consistent long-term record of our weather and climate." | https://www.ecmwf.int/en/forecasts/datasets/reanalysis-datasets/era5 | Hersbach (2018) |
| EB-ET | mm/month | National Tibetan Plateau Data Center, China | 2000-04 | 2017-06 | Global | monthly | 0.05° | Energy Balance Evapotranspiration. | https://data.tpdc.ac.cn/en/data/df4005fb-9449-4760-8e8a-09727df9fe36/ | Chen et al. (2021) |
| GLDAS - NOAH v2.0 | kg/m²·s² | NASA | 1948 | 2014 | Global | 3 hour, daily, monthly | 0.25° | NASA's Global Land Data Assimilation System. This is an assimilation model output layer, not a remote sensing product, per se. The "system" has different models. NOAH v2.0 goes through 2014. |
https://ldas.gsfc.nasa.gov/gldas | Rodell et al. (2004) |
| GLDAS - NOAH v2.1 | kg/m²·s² | NASA | 2000 | present | Global | 4 hour, daily, monthly | 0.25° | Updated version, smaller time range available. | https://disc.gsfc.nasa.gov/datasets/GLDAS_NOAH025_M_2.1 | Beaudoing et al. (2020) |
| GLEAM v3.5a | mm/day | ESA and two Dutch universities | 1980 | present | Global | daily | 0.25º | Global Land Evaporation Amsterdam Model. Based on Priestlay-Taylor, uses microwave data. First published in 2011, updated to v3 in 2017. | https://www.gleam.eu/ | Martens et al. (2017), Miralles (2011) |
| GLEAM v3.5b | mm/day | ESA and two Dutch universities | 2003 | present | Global | daily | 0.25º | Version 3.5 datasets (a and b) include 10 data layers. Includes layers for evapotranspiration plus: transpiration, bare-soil evaporation, interception loss, open-water evaporation and sublimation. | https://www.gleam.eu/ | idem |
| MODIS-ET | mm/day | NASA | 2000 | present | Global | 8 day, annual | 0.01° | Uses daily meteorological reanalysis data and 8-day remotely sensed vegetation property dynamics from MODIS as inputs. | https://lpdaac.usgs.gov/products/mod16a2v061/ | Running et al. (2017) |
| NTSG MODIS-ET | kg/m²/8day | Univ. of Montana, Numerical Terradynamic Simulation Group | 2000 | 2014 | Global | monthly | 0.05° | MODIS-ET data were merged and upscaled to make seamless monthly files by NTSG through 2014 only. | https://www.umt.edu/numerical-terradynamic-simulation-group/project/modis/mod16.php | Mu et al. (2011) |
| NTSG-ET | mm/month | Univ. of Montana, Numerical Terradynamic Simulation Group | 1982 | 2013 | Global | daily, monthly | 0.0833° (5 arcminutes, ~10km) | Used a modified Penman-Monteith equation with inputs from satellite remote sensing and reanalysis for vegetation, daily surface meteorology and solar radiation inputs. | https://www.umt.edu/numerical-terradynamic-simulation-group/project/global-et.php | Zhang et al. (2010) |
| PML | mm/day | China University of Geosciences, Wu Han | 2002 | 2020 | –60°S to 90°N | 8 day | 500m | Penman-Monteith-Leuning Evapotranspiration V2, high-resolution global evapotranspiration and gross primary production. Dataset is very large and only provided via Google Earth Engine. | https://developers.google.com/earth-engine/datasets/catalog/CAS_IGSNRR_PML_V2_v017 | Gan (2018), Zhang (2019) |
| SEBS | mm/day? (not stated) | University of Twente | 2018 | 2018 | Global | daily | 0.05° | SEBS is algorithm, not a dataset. The dataset linked below (Wang, 2019), is ET computed with SEBS at the global scale, but only for a single year. | https://doi.org/10.17026/dans-zw5-yw9b | Ma et al. (2012) |
| SSEBop | mm/month | United States Geological Survey (USGS) | 2003 | 2021 | –60° to +80° | daily, 8-day, monthly | 0.00965° (about 1km near the equator) | Intended use: drought monitoring and early warning purposes | https://www.usgs.gov/data/operational-global-actual-evapotranspiration-using-ssebop-model | Senay et al. (2020) |
| SynthET | mm/month * 100 | Harvard Univ. | 1982 | 2019 | –88° to +88° | monthly | 0.00965° (about 1km near the equator) | ensemble ET estimates from 4 different products with varying temporal coverage: PML, SSEBop, MOD16A2105, and NTSG. The authors simply averaged available data for each time period. | https://dataverse.harvard.edu/dataset.xhtml?persistentId=doi:10.7910/DVN/ZGOUED | Elnashar (2021) |
The US Geological Survey publishes a gridded dataset called disALEXI, an acronym for the Atmosphere Land Exchange Inverse (ALEXI) Disaggregation algorithm (Hook and Fisher 2019). This dataset is based on an instrument onboard the International Space Station (ISS). According to NASA JPL, “the ECOsystem Spaceborne Thermal Radiometer Experiment on Space Station (ECOSTRESS) mission measures the temperature of plants to better understand how much water plants need and how they respond to stress” .
The temporal resolution of this dataset varies, with daily data often available, and the spatial resolution is very high, 30 m. Data are available beginning in 2018 through the present. However, this dataset does not have global coverage. It includes the continental United States, “key biomes/agricultural zones, and selected FLUXNET sites.” As it does not have global coverage, and relatively short records beginning in 2018, I did not use this dataset for the water budget analysis.
I include this short description here, as I came across a few mentions of this dataset in the literature (e.g., Paca et al. 2019; Sriwongsitanon et al. 2020), although it is no longer available. A global version of the CSIRO MODIS Reflectance-based Scaling EvapoTranspiration (CMSR-ET) was formerly published by the UNESCO-IHE Institute for Water Education. This dataset was based on a method developed by scientists at Australia’s Commonwealth Scientific and Industrial Research Organisation (CSIRO) and validated over sites in Australia (Guerschman et al. 2009). Their method calculates potential evapotranspiration using the Priestlay-Taylor method, and incorporates monthly values of the Enhanced Vegetation Index (EVI) and the Global Vegetation Moisture Index (GVMI) derived from the MODIS instruments along with a bias correction routine. A version covering Australia only is available from CSIRO (E. King, Wang, and Raupach 2013).
This global dataset of evapotranspiration is also published by Australia’s Commonwealth Scientific and Industrial Research Organisation (CSIRO). This dataset contains global monthly 0.5° resolution actual evapotranspiration and components (transpiration, soil evaporation, interception) from 1981 to 2012. The estimates were computed through the observation-driven Penman-Monteith-Leuning (PML) model. For details refer to Yu Zhang, Pan, and Wood (2016). Because this dataset ends in 2012, I did not include it in my analyses.
The dataset referred to here as EB-ET is named “Surface energy balance based global land evapotranspiration,” and is published by the National Tibetan Plateau Data Center. It contains daily and monthly data at 0.05° resolution for 2000 to 2017. Technical information is provided by X. Chen et al. (2021). I chose not to use this dataset as there were no updates after 2017.
In my analysis of this dataset, I came across a peculiarity worth noting. Here is an observation intended to be of assistance to future data users. First, the data are distributed as Matlab .mat files, which can nonetheless be read by other software such as Python and R. Second, the authors used a value of 0 for ocean and water body pixels. However, they do not represent an area with no evaporation, but rather missing or uncomputed data. Therefore, users need to be careful to mask out these pixels or convert them to NaN (not a number) to get correct results when calculating spatial statistics, especially near the coast and large inland water bodies.
Evapotranspiration data is available from a NASA climate reanalysis model the Global Land Data Assimilation System (M. Rodell et al. 2004; Beaudoing, Rodell, and NASA/GSFC/HSL 2020). This is an assimilation model output layer and not a pure remote sensing product per se. Nevertheless, such datasets have a number of advantages, such as a long time period and lack of gaps or missing data. Note that version 2.0 is available for 1948 to 2014, while the newer version 2.1 has data for 2000 to present.
The US Geological Survey publishes two related datasets based on data from the Moderate Resolution Imaging Spectroradiometer (Mu, Zhao, and Running 2013, MODIS). The same instrument is onboard different satellites designed and launched by NASA and operated by the USGS. The Terra satellite was launched in December 1999, and ET data (identifier MOD16A2) are available for 2001 to present. The Aqua satellite was launched in May 2002, and ET data (MYD16A2) are available for July 2002 to present. Both datasets are global with a 0.01° resolution, and are available from the USGS at 8-day and annual time steps. According to the publisher, “the MOD16 algorithm is based on the logic of the Penman-Monteith equation which uses daily meteorological reanalysis data and 8-day remotely sensed vegetation property dynamics from MODIS as inputs” (Running et al. 2021).
The 8-day and annual estimates of ET are not compatible with our monthly inputs. Further, the data are published in a sinusoidal projection, rather than in geographic coordinates. These data can be reprojected, and one can make certain assumptions to calculate approximate monthly averages. Because this is a somewhat time-consuming project, I chose not to use MODIS data for my analysis.
This global ET dataset at 8km resolution was created by the Numerical Terradynamic Simulation Group (NTSG) at the University of Montana (K. Zhang et al. 2010, 2015). It provides daily and monthly evapotranspiration for 1983 - 2013 at 5 arcminute resolution (0.08333°, ≈9.3km near equator, 6.6 km at 45° latitude). This data product uses both remote sensing data and reanalysis model results as inputs. The authors used a modified Penman-Monteith approach with biome-specific canopy conductance determined from the Normalized Difference Vegetation Index (NDVI). It also quantifies open water evaporation using a Priestley-Taylor approach. Observations from FLUXNET tower sites were used to parameterize an NDVI-based canopy conductance model. Furthermore, the global ET algorithm was validated using measurements from additional, independent flux towers. A useful aspect of this dataset is that the authors appear to have carefully quantified the accuracy and uncertainty. The authors compared estimated ET to ET inferred from basin-scale water balance calculations and found a reasonably good fit over most biome types (RMSE=186 mm/yr; R²=0.80). While this appears to be a high-quality dataset, I chose not to use it as it ends in 2013 and therefore does not overlap sufficiently with our study period (2000 - 2019).
This dataset, based on the Penman-Monteith-Leuning (PML) method, comes from a team of researchers in Australia and China (Yongqiang Zhang et al. 2019). It was developed in order to study the Earth’s energy and water budgets under climate change. It is among the few global models of evapotranspiration that has a complete carbon constraint on water flux. The authors estimated 8-day global ET and gross primary production (GPP) at 500 m resolution from July 2002 to December 2017 using a model (PML-V2) built using Google Earth Engine. The model’s input includes MODIS data (leaf area index, albedo, and emissivity) and GLDAS meteorological forcing data.
I chose not to use this dataset as it ends in 2017, and I was seeking the maximum overlap with my project time period of 2000 to 2019. Further, it seemed that it would require considerable effort to obtain the data from Google Earth Engine, and to downscale and calculate monthly averages from the 500m, 8-day data. However, according to the project website, the dataset has been updated twice since its original publication, and data is available through near the present. As this appears to be a high-quality dataset, it may be worth including in future global water balance studies.
I found mentions of an evaporation dataset called SEBS in two articles: one on the spatial variability of actual evapotranspiration across the Amazon River Basin (Paca et al. 2019) and another on evapotranspiration in Australia (Ma et al. 2012). This dataset was previously published by the UNESCO Water Accounting project, but appears to be no longer available. Further research revealed that SEBS is not a dataset per se, but a model for calculating ET based in part on remote sensing data, the Surface Energy Balance System (Su 2002). The model estimates atmospheric turbulent fluxes and evapotranspiration using satellite earth observation data, in combination with meteorological information. The 2002 journal article introducing SEBS has been cited over 2,200 times, which leads one to conclude that the model is widely used, or at least influential. One scientist (L. Wang 2019) published a SEBS-ET datasets at the global scale, but it only covers a single year. Therefore, I did not include any SEBS data in the analysis.
Operational Global Actual Evapotranspiration using the SSEBop model, is a global dataset of ET recently published by the US Geological Survey. ET is estimated over global land surfaces using the Simplified Surface Energy Balance (SSEBop) model. The model gives daily total actual evapotranspiration based on inputs of land surface temperature, maximum air temperature, and reference ET from the GLDAS climate model (Senay et al. 2013). The resolution is high (1km), and data is available from 2003 to present. I did not use this dataset for the main analyses presented in this thesis, but it is an excellent candidate for future experiments.
A final remote sensing-based ET dataset is worth mention due to its long record, from January 1982, and goes through December 2019. Elnashar et al. (2021) created this long time series merging multiple satellite datasets. (The authors made the primordial mistake of failing to give their dataset a clever name, so I refer to it here as “Synthetic ET.”) The dataset is delivered at a relatively high resolution of 1km, although the underlying data resolution is usually lower, especially for older data.
For this dataset, the authors obtained 4 different ET datasets, with varying temporal coverage:
In this dataset, the authors made no attempt to weight or optimally merge the datasets, but rather calculated the simple mean of the datasets that were available for a given time period.
Based on some exploratory data analysis of this dataset, there are step changes in the time series in many locations, where the data transitions from one set to another. 27 I concluded that this makes this dataset unsuitable for use. Merging different datasets to create a longer time record is a valuable concept. However, I believe that more careful intercalibration and error correction is needed before such a dataset can be used.