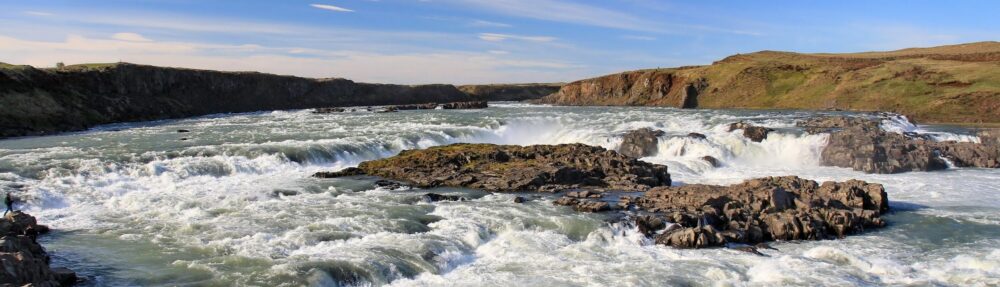
This is one of my favorite PSAs — public service announcements. It’s 20 years old, but it still does a great job showing how “invisible” pollutants can contaminate downstream waterways.
To find out what’s upstream and downstream of where you live, work, or play, try the Global Watersheds App on this site! https://mghydro.com/watersheds
The Los Angeles Times magazine recently published a fantastic article on the Los Angeles River, exploring its history and plans for its redesign. The author, the Times architecture critic Michael Kimmelman, writes that, “Angelenos live, work and play along it, but know little of its origins.” I think you could say the same about the residents of any city astride a river, great or small.
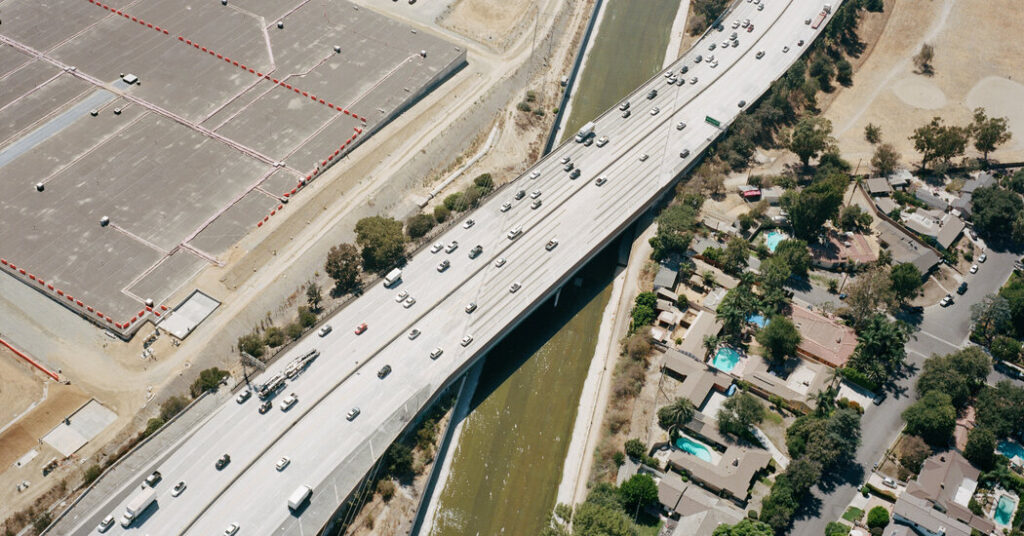
Aerial view of the Venura Freeway over the Los Angeles River on the border of Burbank and Los Angeles (GPS: 34.155, -118.316). Photo by Adali Schell, LA Times. Where do these troubled waters come from? According to the author, “the headwaters of the Los Angeles River aren’t easy to find.”
However, it has never been easier to find a river’s watershed. I have been delighted by how many Wikipedia articles about rivers contain high-quality watershed maps. Most of these were created for free by amateur cartographers and are free to reuse. Many of them are made by a small handful of contributors. Kmusser and Shannon1, you are unsung watershed heroes!
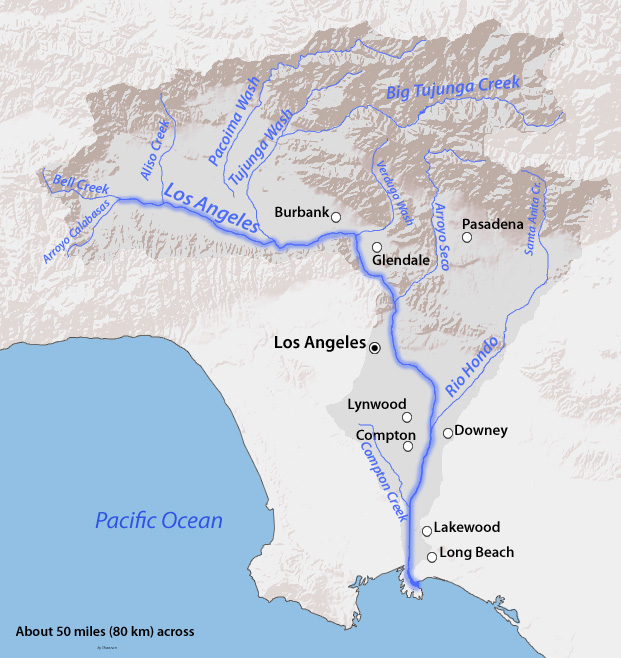
Map of the Los Angeles River watershed, by USGS and Wikipedia user Shannon1.
One day, maybe every article about a river will have a map of its watershed. This is especially useful when you want to understand more about pollution, flooding, or land use. And might I suggest that it has never been easier to map a watershed thanks to the free Global Watershed App on this site? For example, here is an interactive map of the Los Angeles River watershed created with the app:
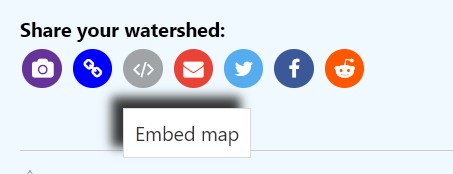
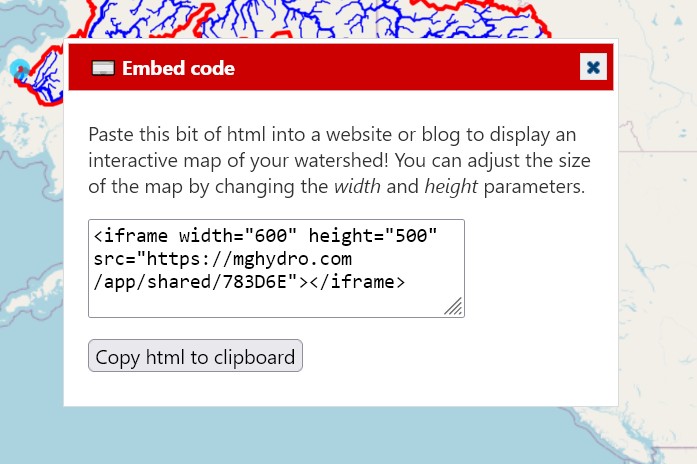
I added another feature to the Global Watersheds App. After you’ve mapped a watershed, you can embed an interactive map. On the left side menu, look for the embed button under “Share your watershed.”
You can paste the html code into your website or blog to put a nice embedded map onto your site. You can adjust the size by changing the numbers for height and width in the html.
Here is an example. I embedded the watershed of the Yukon River in Alaska in this post on my WordPress blog. In WordPress, you have to click Add block, then choose the block type “Custom html.” You may see a warning, “This block contains unexpected or invalid content.” I ignored the warning and published the post, and the map appears like it should.
I’ve set up an API for the watersheds app so you can get watersheds even if you’re not using the web app. You just need to provide a carefully formatted URL. There is a separate link for watershed boundaries and for rivers.
The API returns a GeoJSON string that many applications can use. To use it, you need to provide the latitude and longitude of a watershed outlet, and tell it if you want high-precision or low. (Note that if your watershed has an area of over 50,000 km², the app will automatically revert to low-precision, regardless of what you requested.)
Remember that, just like the regular web app, it can take a while for the app to create large watersheds for the first time. (After they’ve been generated once, the result is cached. Making the same request a second or third time should be fast.)
This feature is experimental and subject to change! Drop me a line and tell me if you are using it for something cool.
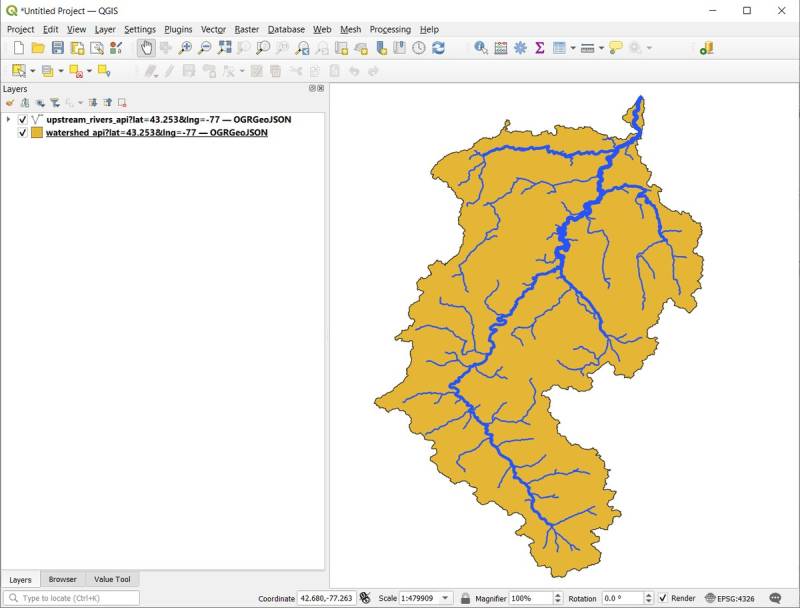
With the API, you can plug the URL right into QGIS. Choose Layer > Add Layer > Add Vector Layer, then and in the field, “Vector Dataset(s),” add the URL, then click “Add.” Adjust the styles, and you can have something that looks like this:
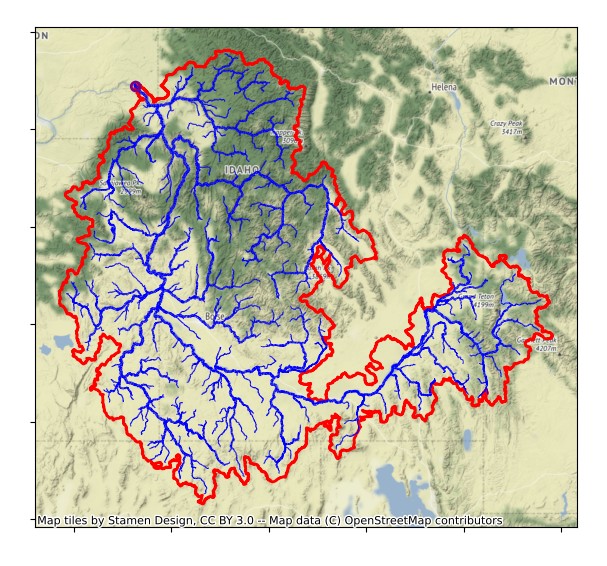
I recently tried my hand at using NLDI, the new water data web service from the U.S. Geological Survey. The service provides access to water data from the National Hydrography Dataset (NHD), version 2. I was specifically interested in using the NHD geodata to delineate watersheds. This data was digitized from 1:100,000-scale maps. (There is newer, more detailed data, called NHDPlus HR, for high-resolution, but no web service for these data yet.)
Snake River watershed upstream of the Lower Granite Dam in eastern Washington state (just a location I picked at random for this demo!)
It took me a couple days of tinkering to get the results I wanted, but the results look impressive and seem accurate. You can run the code yourself by downloading one of these files from GitHub Gists. (Or follow along below.)