This week, I added an exciting new feature to Global Watersheds — Watershed Data Reports now include information on endangered species. The app finds species whose range overlaps the watershed and displays some basic information about them, with links to more detailed info. For example, see this Report on the Seine upstream of Paris, France.
Data on endangered species comes from the IUCN Red List, by the International Union for the Conservation of Nature. The IUCN is an international organization that compiles authoritative information on endangered species around the world. If I understand correctly, much of the actual work is done by volunteers.
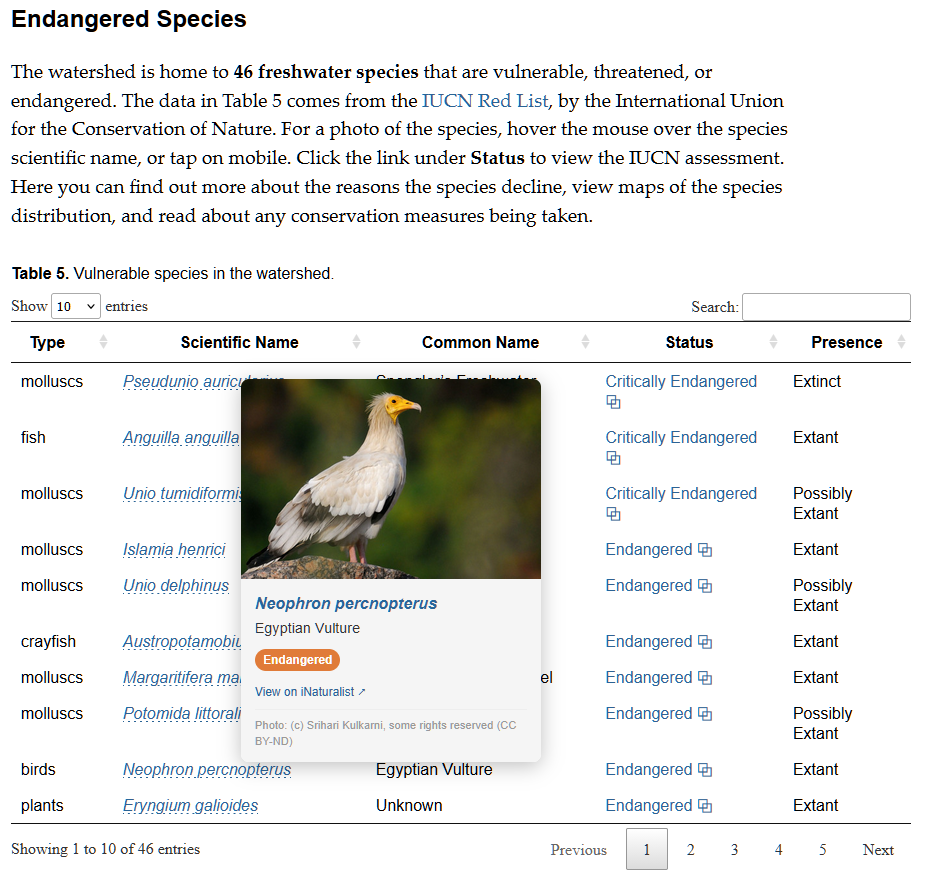
To build this new feature, I downloaded the geodata on species range from the IUCN, focusing on “freshwater species.” This includes plants, fish, mollusks, and crabs, but also a large category “other” that included mammals, birds, amphibians, fungi, etc. It makes sense, as these species rely on freshwater too.
By default, the species are ranked by their conservation status, with “critically endangered” species at the top. This means that the population is declining and there is an imminent risk of extinction. Another category is “vulnerable,” meaning there is a high risk of extinction in the wild. Finally, “near threatened” means that the species “is close to qualifying for or is likely to qualify for a threatened category in the near future” according to the IUCN.
If you hover over the scientific name, you can view photos of many of the species, courtesy of iNaturalist.com. Click through to iNaturalist to view more photos and find a wealth of other information. The table also includes a link to the IUCN’s latest latest assessment of the species status. Here, you can get detailed information on the species, view a map of its range (where it lives, breeds, or migrates), and read about the reasons for its decline and any conservation actions that are being taken to protect the species.
I noticed that the maps on the IUCN’s web page don’t always load correctly. I emailed the IUCN about this, and got this prompt reply: “We are indeed aware of this issue and working to solve it. At the moment, images of the maps can be found in the assessment PDF, and the underlying spatial data can be downloaded as well. Both of these are available from the “Download” button on the top-right of each species page.”
I have found this new feature to be extremely eye-opening and somewhat alarming. There are threatened and endangered species in every watershed on Earth.
I had no idea there were so many endangered freshwater mollusks. (I also didn’t know much of the English-speaking world spells it mollusc, with a C!) Many of these snails and bivalves don’t even have a common name. Is this lack of familiarity be a barrier to their conservation?
The photos of birds are so gorgeous; it would be such a shame to allow such beautiful creatures to go extinct.
I decided to add a section with the title What Can I Do? Hopefully this will inspire people to take action. I hope this has the right tone. While the situation for many species is dire and they face many threats, there is much that can be done and we can’t give in to despair.
Let me know what you think. What do you notice in your watershed? How do you think this information could be used? Please don’t hesitate to be in touch to share your thoughts.

